Publishing every day can create the impression that a social media strategy is working. The calendar is full, comments are being answered, and the monthly report contains plenty of numbers. Yet one question often remains surprisingly difficult to answer: which posts actually helped the business?
That gap appears when scheduling and measurement are treated as separate jobs. A scheduling tool can keep content moving, but the calendar alone cannot explain whether a post generated qualified traffic, enquiries, sign-ups, or sales. Social media analytics provides the missing feedback. It shows what happened after publication and gives the team evidence it can use before scheduling the next post.
The strongest workflow connects the two. Content is planned, published, measured, discussed, and then improved. Each campaign leaves behind useful information instead of disappearing into an old report.
Use Data to Stop Repeating Weak Content
Likes and comments are useful indicators, but they do not tell the whole story. A post can attract a large number of reactions without sending a single qualified visitor to a website. Another may receive modest public engagement while contributing to newsletter subscriptions, demo requests, or purchases.
The right metric therefore depends on the purpose of the post. For example:
- Awareness content: reach, impressions, video views, completion rate, and follower growth.
- Engagement content: comments, saves, shares, replies, and meaningful conversations.
- Traffic content: link clicks, click-through rate, engaged sessions, and landing-page behaviour.
- Conversion content: sign-ups, enquiries, downloads, purchases, and cost per result.
This distinction matters because a post should be judged against the job it was created to do. Expecting every post to generate sales is unrealistic; celebrating reach when the campaign objective was lead generation is equally misleading.
A simple weekly review is usually enough to expose recurring patterns. Compare posts with the same objective, audience, platform, and format. Look for topics that repeatedly earn qualified clicks, hooks that hold attention, and calls to action that lead to the next step. Do not make a major decision from one unusually strong or weak post. A pattern across several comparable posts is much more useful than a single spike.
Compare Platforms Without Treating Their Metrics as Identical
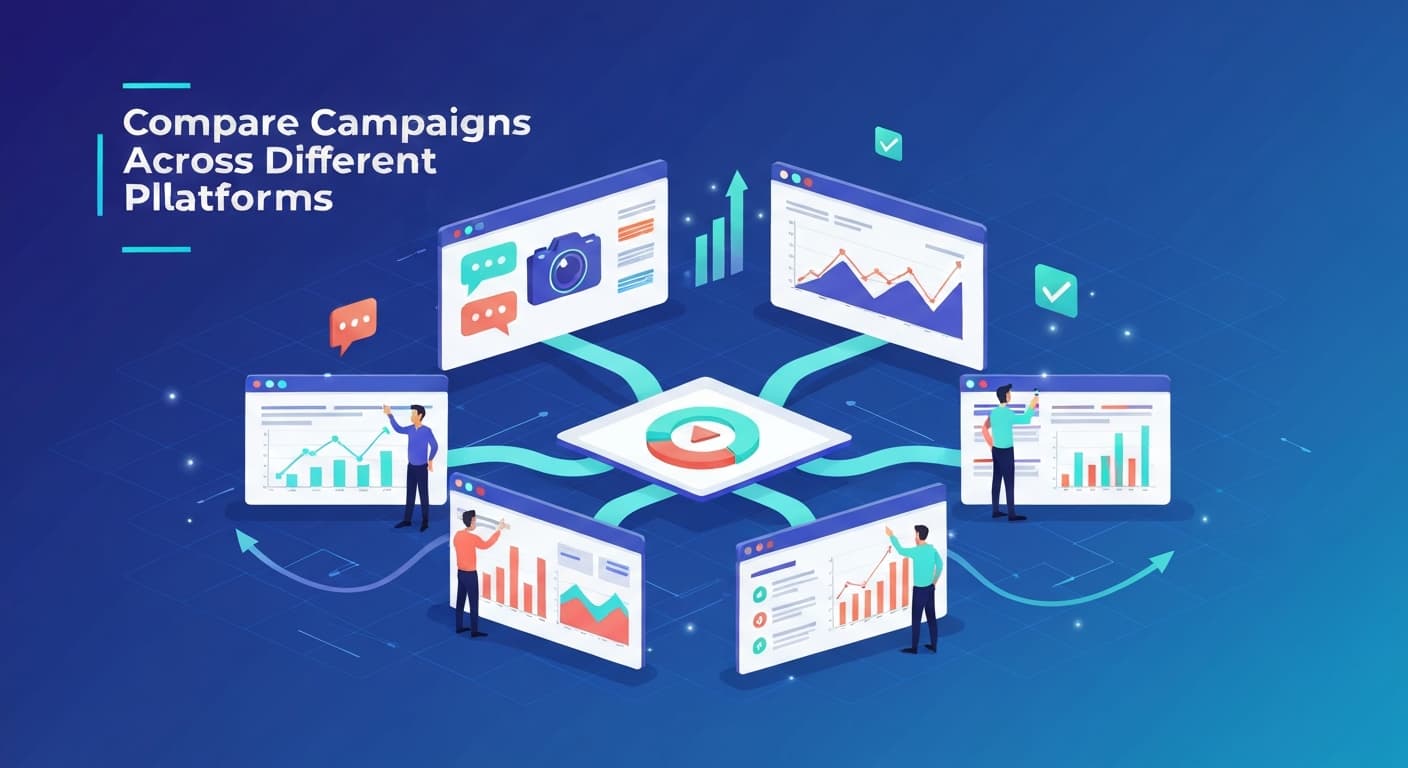
The same idea can perform very differently from one platform to another. That does not necessarily mean the idea is weak. Audience intent, content format, distribution systems, and user behaviour vary by channel. A detailed professional post may suit LinkedIn, while a visual demonstration or short video may communicate the same point more effectively on Instagram or TikTok.
Native analytics help explain these differences. For example, LinkedIn Page Analytics separates content, follower, visitor, and search-appearance data. Meta Business Suite Insights reports on organic and paid activity across a Facebook Page and Instagram account.
Cross-platform reporting becomes valuable when those data sources are brought into one consistent view. However, the numbers need context. An impression on one platform is not always calculated in exactly the same way as an impression on another, and native dashboards may not match third-party tools because of reporting windows, API limitations, time zones, or data updates.
For a fair comparison, use a shared business measure wherever possible. Instead of asking which platform produced the most reactions, compare:
- qualified website visits per platform;
- key actions completed after a visit;
- cost per lead or acquisition for paid campaigns;
- conversion rate by channel; and
- the quality of leads or customers generated.
This makes budget and content decisions more defensible. A smaller channel may deserve more attention if it consistently brings better-fit visitors or stronger conversion rates.
Learn When Your Audience Is Most Responsive
Generic advice about the “best time to post” can be a useful starting point, but it should not become a permanent rule. Audience location, industry, working hours, age, and platform habits can all affect when a post is likely to be seen. Buffer’s analysis of posting times, for example, shows different patterns across major social networks rather than one universal publishing window.
Your own account data is more useful than a broad benchmark once enough information has been collected. Review performance by day and time over several weeks, but compare like with like. A product announcement posted on Tuesday morning should not be treated as a clean timing test against a casual behind-the-scenes video posted on Saturday evening. The topic, format, audience, and distribution method may have influenced the result as much as the time.
A practical test might look like this:
- Select one repeatable content format and one clear objective.
- Publish comparable posts in two or three time windows.
- Use the same measurement period for every post.
- Repeat the test often enough to reduce the effect of one-off events.
- Schedule more content in the strongest window, then test again later.
The aim is not to discover a perfect posting time that will work forever. Audience habits change, and platforms change with them. The aim is to build a schedule that responds to current evidence rather than relying indefinitely on an industry average.
Understand the People Behind the Numbers

Post-level metrics explain how content performed. Audience analytics adds another layer by showing which groups responded and how they interacted. Depending on the platform and the amount of available data, this may include location, seniority, industry, age range, device category, follower growth, or active periods.
These insights can change both the message and its delivery. If most website visits from a campaign happen on mobile devices, the landing page and sign-up process need to work well on a small screen. If a LinkedIn Page is attracting professionals from an unexpected industry, the team may have found a new audience segment worth testing. LinkedIn’s visitor analytics guidance explains the traffic and demographic information available to Page admins, while Meta provides separate guidance on Instagram Insights.
Audience data should still be interpreted carefully. Demographic reports are often aggregated, modelled, limited by privacy thresholds, or available only for certain account types. They are signals, not a complete profile of every person who viewed a post. Combine them with customer interviews, sales feedback, support questions, and on-site behaviour to build a more reliable picture.
When these insights feed into scheduling, the calendar becomes more specific. The team can choose the platform, format, message, and publishing window around a defined audience rather than broadcasting the same post everywhere.
Connect Social Activity to Business Goals
Engagement reports are easy to produce because the data is readily available inside social platforms. Business impact is harder to measure. A person may see a post, visit the website days later through another channel, and complete a purchase after several additional interactions. That journey cannot always be credited neatly to one post.
The first step is to define the action that matters. In Google Analytics, an important action such as a purchase, form submission, or registration can be marked as a key event. Social links should also use a consistent campaign-tagging convention. Google’s official guide to collecting campaign data with custom URLs explains how UTM parameters identify the source, medium, and campaign associated with a visit.
For example, a team might use:
- utm_source for the platform, such as linkedin or instagram;
- utm_medium for the channel type, such as organic_social or paid_social;
- utm_campaign for the campaign name; and
- utm_content to distinguish individual creatives, formats, or calls to action.
Naming needs to be consistent. “LinkedIn,” “linkedin,” and “li” may appear as three different sources in a report even though they refer to the same platform.
Once tracking is in place, the reporting conversation becomes more useful. Instead of asking only how many likes a campaign received, the team can examine which posts attracted engaged visitors, which campaigns contributed to key events, and where people left the journey.
This still does not produce a perfect statement of ROI. Attribution depends on tracking quality, consent choices, device changes, offline activity, and the model used to assign credit. Google’s explanation of attribution settings is a useful reminder that credit can be distributed differently across touchpoints. Report social media’s contribution with appropriate context rather than presenting an estimated number as absolute fact.
Turn Reporting Into Better Team Decisions

Data has limited value if it remains in a dashboard that only one person opens at the end of the month. The people planning, writing, designing, approving, and promoting content all need access to the lessons behind the numbers.
A shared analytics and scheduling workflow gives each role something practical:
- Writers can see which topics, openings, and calls to action deserve another iteration.
- Designers and video teams can compare formats, watch time, completion rates, saves, and clicks.
- Strategists can adjust audience, channel, and budget decisions while a campaign is still active.
- Editors and managers can connect upcoming calendar choices to previous results.
- Sales and customer teams can add qualitative context about lead quality and recurring customer questions.
The most useful review meetings do not read every number aloud. They answer a small set of decision-focused questions:
- What changed compared with the previous period?
- Which result was expected, and which was surprising?
- What evidence might explain the difference?
- What will we repeat, stop, or test next?
- Who owns the change, and when will it be reviewed?
This turns reporting into an operating habit rather than a presentation exercise. The dashboard shows the evidence; the team still supplies the context and judgement.
A Practical Measurement Workflow
Teams do not need an elaborate system on day one. A dependable framework can begin with six steps:
- Define the objective: decide whether the campaign is intended to build awareness, encourage engagement, generate traffic, or drive a conversion.
- Select a small KPI set: choose one primary measure and a few diagnostic metrics. Avoid treating every available number as equally important.
- Set up tracking: check key events, campaign tags, landing pages, platform connections, and reporting time zones before publication.
- Schedule with a test in mind: vary one meaningful element, such as the hook, format, call to action, or publishing window.
- Review on a fixed cadence: use the same comparison window and record relevant context, including paid support, major events, or platform issues.
- Apply the learning: turn the result into a specific calendar change and document what will be tested next.
The final step is the one most often missed. Analytics is not valuable because it produces more reports. It is valuable when a finding changes a future decision.
From Consistent Publishing to Consistent Learning
A full content calendar is an output, not proof of progress. Sustainable improvement comes from learning which messages reach the right people, which channels support the business objective, and which actions users take after seeing the content.
Connecting analytics with scheduling creates that learning loop. Every post becomes both a communication asset and a small source of evidence. Over time, the team can spend less energy defending assumptions and more energy refining ideas that have shown genuine potential.
The goal is not to let a dashboard make every creative decision. Data cannot fully measure brand trust, cultural relevance, or the long-term effect of a helpful conversation. It can, however, reveal patterns, challenge weak assumptions, and make the next publishing decision better informed than the last.
FAQs
What is social media analytics?
Social media analytics is the process of collecting, organising, and interpreting data from social platforms and connected website or app analytics. It helps a team understand content performance, audience behaviour, traffic, and business outcomes. Its purpose is not simply to describe past activity; it should inform what the team creates, schedules, and tests next.
Why should analytics be connected to a scheduling workflow?
Scheduling controls when and where content is published. Analytics shows what happened afterwards. When the two are connected, performance data can influence future topics, formats, platforms, publishing windows, and calls to action. Without that feedback, the team may continue repeating a routine without knowing whether it supports its goals.
Can results from different social platforms be compared in one dashboard?
Yes, many analytics and scheduling platforms combine data from several networks. The comparison still needs care because platforms may define and update metrics differently. Use native analytics to investigate platform-specific performance and shared business measures—such as qualified visits, leads, or purchases—to compare channel contribution more fairly.
How often should a team review social media performance?
A weekly review is useful for identifying operational changes and active-campaign issues. Monthly or quarterly reviews are better for wider trends, audience shifts, and strategic decisions. The right cadence depends on posting volume and campaign length, but every review should use a consistent time window and lead to a documented action.
How can social media traffic be tracked accurately?
Use a consistent UTM naming convention on social links, configure important website or app actions as key events, and test tracking before launch. Keep paid and organic traffic clearly separated. Also record changes that may affect the data, such as budget increases, tracking updates, or a new landing page.
Can analytics prove the exact ROI of every social post?
Not always. Tracking gaps, consent settings, cross-device journeys, offline actions, and attribution models can all affect the result. Analytics can provide strong evidence of contribution, especially when campaign tags and key events are configured correctly, but responsible reporting should explain assumptions and limitations.
Does every social media scheduling tool include analytics?
No. Some tools focus mainly on publishing, while others include channel reporting, campaign tracking, listening, or website integrations. Before choosing a tool, check which platforms and metrics it supports, how often data refreshes, whether historical data is available, and whether reports can connect social activity to the organisation’s actual goals.